Adrien Kunysz, Thu, 24 Feb 2011 13:37:42 GMT
This article describes a bug I found in a multithreaded C application, how I tracked it down and how it was fixed. This may be of interest if you want to see how to use Valgrind's memcheck and dig into foreign code.
Every few weeks, GMsoft tries to get people interested in his network sniffer^W^Wreal time packet processor and every time I give it a quick look and become promptly unimpressed by the Ciscoesque interface and my lack of use for it. I mean, it looks like a great tool if you want to sniff Facebook cookies live out of conference networks and push them into your MySQL database or collect a copy of all the porn your neighbours are watching (to give purely fictional examples) but I stopped this kind of things some time after entering the uni and Wireshark does almost everything I need nowadays.
Nevertheless, I somehow ended up attempting to fuzz packet-o-matic. The idea is to throw all kind of crap at it until it breaks. I have been doing that with various other software in the past and I often end up finding interesting bugs. So, I generated a small pcap capture file, spent some time figuring out how to feed it to packet-o-matic then zzufed the thing in the hope of catching p-o-m choking on one of the tweaked files.
Within a few seconds my whole system started to feel sluggish and my hard disk drive LED was blinking like it was Christmas. It quickly became obvious that p-o-m was eating so much memory as to cause my system to swap itself to death. After patiently waiting for the OOM killer to do its job, I was back to normal and considering how to track down the problem.
First, I reproduced the bug more carefully by feeding p-o-m the capture file only a hundred times before stopping, measuring its memory consumption after each iteration. I got something like this:
VmSize:    70024 kB
VmRSS:     18060 kB
VmSize:   758536 kB
VmRSS:     59688 kB
VmSize:   766800 kB
VmRSS:     62516 kB
VmSize:   774996 kB
VmRSS:     86072 kB
VmSize:   783192 kB
VmRSS:    121800 kB
VmSize:   856924 kB
VmRSS:    157332 kB
VmSize:   865120 kB
VmRSS:    190116 kB
VmSize:   873316 kB
VmRSS:    220140 kB
VmSize:   881512 kB
VmRSS:    247656 kB
VmSize:   889708 kB
VmRSS:    272572 kB
This clearly shows unbounded increase in memory usage but that doesn't tell us where is the problem. Enters Valgrind.
You can think of Valgrind as a virtual machine that can run your processes.
This virtual machine comes with several instrumentation tools among which a
memory analyser called memcheck. Memcheck will automatically detect many
memory manipulation problems among which memory leaks. The way it works is
that it keeps track of what blocks have been allocated/released with
malloc() and free() then tells you what has not been freed by the time
you exit the program. More importantly it will also tell you what allocated
the blocks that have not been freed and it can also filter out blocks to which
the program still have references at exit time.
In practice, I started p-o-m with something like this:
$ valgrind --tool=memcheck --leak-check=full ./packet-o-matic
Then, p-o-m being an interactive program with a telnet interface (I told you it was Ciscoesque), I reproduced the problem by feeding it my small capture file a couple of time then made p-o-m exit. The Valgrind output looked like this:
==3364== 1,632 bytes in 6 blocks are possibly lost in loss record 2 of 2
==3364==    at 0x4C203E4: calloc (vg_replace_malloc.c:397)
==3364==    by 0x40108BE: _dl_allocate_tls (in /lib/ld-2.7.so)
==3364==    by 0x67BC6BA: pthread_create@@GLIBC_2.2.5 (in /lib/libpthread-2.7.so)
==3364==    by 0x406948: start_input (main.c:348)
==3364==    by 0x411988: mgmtcmd_input_start (mgmtcmd_input.c:168)
==3364==    by 0x40CBB1: mgmtsrv_process_command (mgmtsrv.c:432)
==3364==    by 0x40E231: mgmtvty_process_key (mgmtvty.c:739)
==3364==    by 0x40E7BC: mgmtvty_process (mgmtvty.c:260)
==3364==    by 0x40CD3C: mgmtsrv_read_socket (mgmtsrv.c:294)
==3364==    by 0x40D0DF: mgmtsrv_process (mgmtsrv.c:204)
==3364==    by 0x406A66: mgmtsrv_thread_func (main.c:285)
==3364==    by 0x67BCFC6: start_thread (in /lib/libpthread-2.7.so)
This means the memory that is leaked is allocated through calloc() from
within the POSIX pthread_create() function which is itself called by
the start_input() function (that one being defined in packet-o-matic).
So, let's have a look at start_input():
311 int start_input(struct ringbuffer *r) {
...
348         if (pthread_create(&input_thread, NULL, input_thread_func, (void*)r)) {
This tells us the start_input() function creates a thread that is running
the input_thread_func() function. Careful reading of the manual page for
pthread_create() shows this:
int pthread_create(pthread_t * thread, pthread_attr_t * attr,void * (*start_routine)(void *), void * arg);
[...]
A thread may either be joinable or detached. If a thread is joinable, then another thread can callpthread_join(3)to wait for the thread to terminate and fetch its exit status. Only when a terminated joinable thread has been joined are the last of its resources released back to the system. When a detached thread terminates, its resources are automatically released back to the system: [...]
By default, a new thread is created in a joinable state, unless attr was set to create the thread in a detached state (usingpthread_attr_setdetachstate(3)).
We can clearly see the thread is created as joinable since the attr
argument is NULL. Now, let's check if it is possible for the thread to complete
without another thread ever calling pthead_join() on it (thus leaking
memory).
The input_thread_func() function looks like this:
394 void *input_thread_func(void *params) {
395
396         struct ringbuffer *r = params;
...
421         while (r->state == rb_state_open) {
...
429                 if (r->state != rb_state_open)
430                         break;
...
432                 if (input_read(r->i, r->buffer[r->write_pos]) == POM_ERR) {
...
448                         break;
449                 }
450
451                 if (!r->i->running) { // Input was closed
452                         main_config->input_serial++;
453                         break;
454                 }
455
...
498         }
...
524         r->state = rb_state_closed;
525
526         pom_log(POM_LOG_DEBUG "Input thread stopped");
527
528         return NULL;
529 }
We can see the function may complete by itself whenever it runs out of "input"
(in our case when it completes reading of the capture file), hence terminating
the thread. There is only one pthread_join() for this thread:
365 int stop_input(struct ringbuffer *r) {
366
367         if (r->state != rb_state_open && r->state != rb_state_stopping) {
368                 pom_log(POM_LOG_WARN "Input not yet started");
369                 return POM_ERR;
370         }
...
377         r->state = rb_state_stopping;
...
384         // interrupt current read()
385         pom_log(POM_LOG_TSHOOT "Sending signal to interrupt the input thread");
386         pthread_kill(input_thread, INPUTSIG);
387
388         pthread_join(input_thread, NULL);
389
390         return POM_OK;
391
392 }
We see this function is meant to interrupt the thread and if it already
completed the pthread_join() will never happen because input_thread_func()
will have set its state to rb_state_closed by itself at line 524 before
returning. Hence the test at line 367 succeeds and stop_input() returns
early without cleaning up the memory that has been allocated at thread creation
time.
Therefore, we need a way to clean up when input_thread_func() terminates
without being interrupted by another thread. After spending some time trying
to find a good place to put the pthread_join(), I realised we could actually
make input_thread_func() clean up by itself. We just need to change to the
detached state immediately before returning and voilà, the memory will be
automatically cleaned (as per the pthread_create() manual above).
The patch I offered looks like this:
--- src/main.c  (revision 368)
+++ src/main.c  (working copy)
@@ -525,6 +525,8 @@ void *input_thread_func(void *params) {

        pom_log(POM_LOG_DEBUG "Input thread stopped");

+       pthread_detach(input_thread);
+
        return NULL;
 }
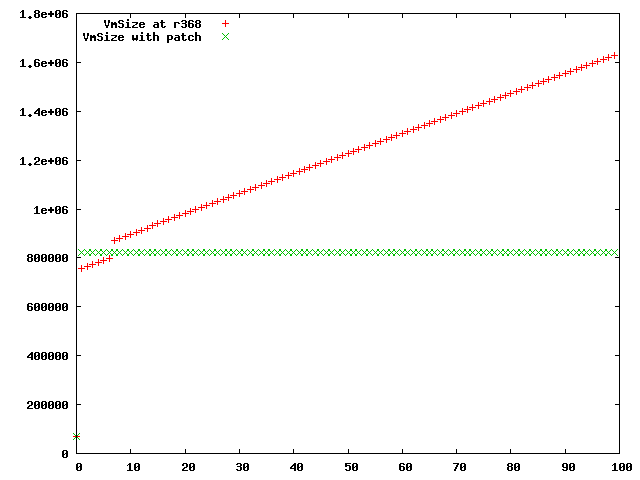
I then rebuild packet-o-matic, reran the initial test measuring the memory usage after each processing of the capture file and played a bit with gnuplot to produce this graph:

The red crosses show the virtual memory allocated to the process before the patch when making it process the capture file a hundred time. Compare to the green crosses measuring the same thing after applying the patch. Clearly, this is an improvement.